It’s hard to build a brand without Mental Availability (MA). And it’s not just us saying it. If you have any doubts, read the work of Peter Field and/or Rob Brittain. MA is a competitive metric that assumes there is a finite number of brands competing for space in your memory. Which means, if one rises in the ranking, one must fall.
This, of course, all matters most at the purchase occasion. The moment someone with money is about to wave their card across a POS terminal and walk away with the drink they think will best quench their thirst. Let’s be clear, 99.9% of the time that’s a human (yes, it’s possible that a clever dog could tap and go).
That human just wants a drink.
They mostly don’t work in advertising.
They’re not thinking about ad performance metrics.
They’re not lovingly remembering the body of work their preferred drink brand has delivered to the viewing world.
They just want a drink.
Their drink.
Now.
Because they’re thirsty.
It’s a basic human need.
If your level of MA is nice and high, and your product is available, you can expect your market share to increase. Which is just one reason that MA is considered a true north measure of brand strength.
What does this have to do with attention?
In 2021, with our research client, OMD Worldwide, we recruited 600 people in the USA who collectively viewed more than 3,300 impressions across three online video platforms. It was an attention gaze, controlled brand data collection measuring three levels of attention – non, passive and active. After the viewing experience, respondents were sent to complete an MA survey which was indexed against a non-exposed baseline to determine uplift. In total we considered 12 brands across three categories.
Here’s what we found:
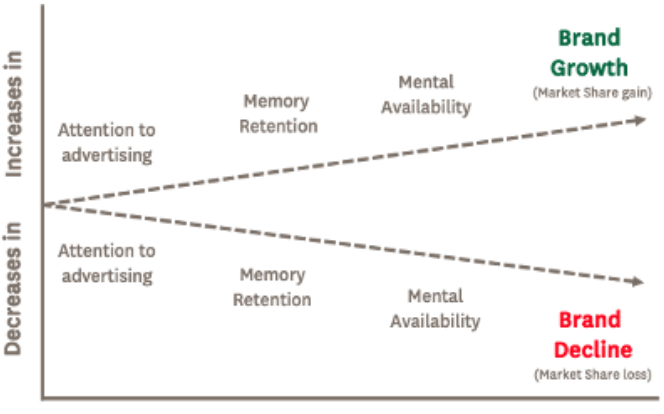
Finding 1: Increases in attention gives a brand some chance of market share growth, while decreases in attention will likely impart brand decline (r = .77, p = < .05). In other words, when active attention is paid MA uplift is notably positive and when no attention is paid MA uplift is notably negative (or no sizable change).
Finding 2: The amount of MA uplift achieved is in line with the platform average active attention score. In other words, platforms that inherently deliver higher levels of attention will likely drive higher MA uplift.
Finding 3: In 3/4 of cases, no attention drove no-uplift/decline, while active attention drove MA uplift. On average across all brands, we saw a 6pp difference between the MA uplift of exposed versus non exposed.
Finding 4: The remaining 1/4 of cases where the relationship did not hold can be explained by Double Jeopardy. While attention was paid to the test brand, the associations were attributed to the larger competitor due to the creative execution (ie, new/non distinctive packaging, brand not obvious and not early).
Double Jeopardy explainer: Even with attention, if the brand is missing, the viewer fills in the blanks. And the attention you work so hard for is likely to be misattributed to the larger competitor.
None of this is surprising, but it’s one thing to have a hunch and quite another to have the data to back it up. MA is about remembering the brand, and our previous research shows that active attention seconds are linked to memory retention and that attention performance of the platform and format is the driver of rate of memory decay.
In simple terms, the path from attention to brand growth/decline looks this:

What does this mean for you?
Attention drives sales and Mental Availability, choose high attention formats and use your branding to make sure this attention works for you (and not your competitors).
